

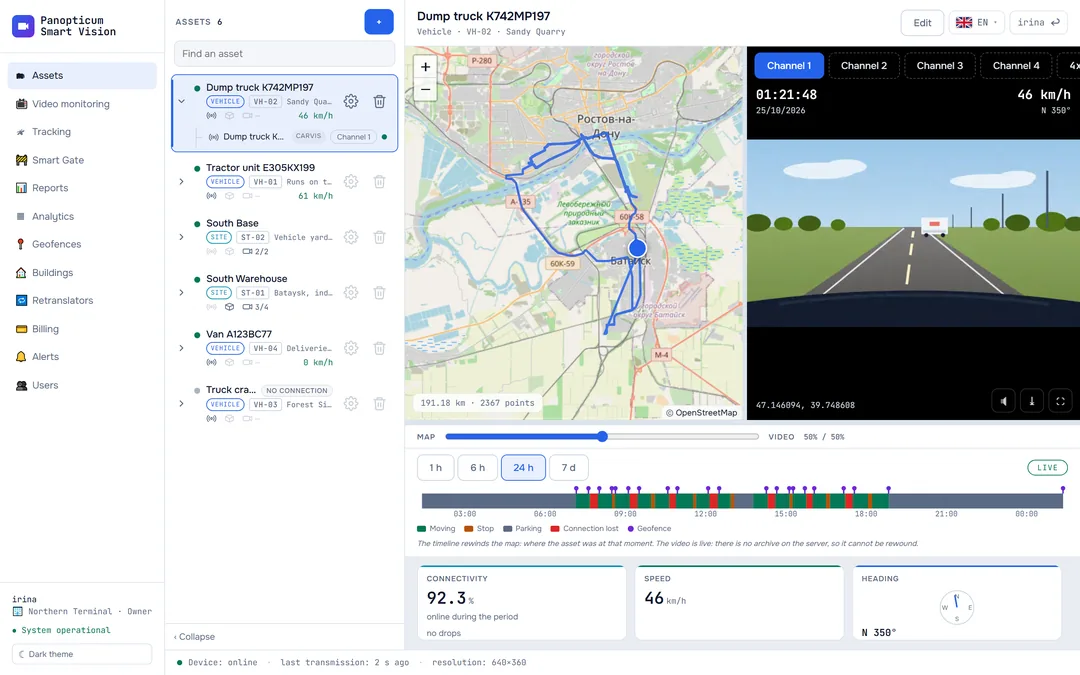
Tracking is the map of all the account’s devices: where each vehicle is now, how fast it is going, what its sensors report, where it drove over the period and whether it was online. Video from Carvis DVRs and the layer of weigh-in-motion stations are here too.
The section screen
The map takes the whole screen, and the panels lie on top of it. The device list is on the right, the “Connectivity” panel at the top left, the selected device’s telemetry under it and the track history at the bottom.

- Devices: who is online, speed
- Telemetry of the selected device
- History: period and a slider along the track
- Device connectivity for the day
- WIM station layer
Devices
Each device in the list shows its name, number plate, speed and how long ago the last packet came. A green dot: the device is online, that is, it has sent data within the last three minutes. Clicking a row selects the device: the telemetry and history open, and the map moves to the vehicle.
- Follow: the map follows the vehicle and keeps it in the centre.
- Video: only for Carvis DVRs, opens video from the chosen channel (see DVR video).
- The bin deletes the device; the owner and operators see it.
The owner and operators add a new device with the “+ Device” button at the top right: protocol, identifier, name and number plate. It can be added in advance, before the device comes online: as soon as it appears, the vehicle takes its place on the map. Details in How to connect a device.
Telemetry
The selected device’s panel shows the speed, heading, altitude, mileage, coordinates, number of satellites, mobile signal level, ignition, whether there is a satellite fix, the packet age and the device’s own clock. The set depends on what the device sends:
- Navtelecom devices send the most: on-board voltage, fuel from the CAN bus and the level sensor, engine speed, engine temperature, engine hours. The long list is split into groups that expand with a click;
- Carvis DVRs also report on their cameras: which channel has no video signal;
- at the very bottom of the panel there are alarms, if the device reports them.
Track history
The bottom panel shows the selected device’s path over 1 h, 6 h, 24 h or 7 d: a blue line on the map, the number of points and the mileage for the period. The slider under it takes the vehicle along the track and shows the time and speed at each point. “Hide” removes the track from the map.
A long track is simplified on the map to a couple of thousand points: this way it draws quickly and keeps its shape. Detailed tables of trips, parking and mileage are built in the Reports section.
Points after the fact. A device that has lost its connection stores points in memory and sends them when the connection returns. They go into the track with their own time rather than the time of delivery, so the gap in the track fills in by itself.
- There is a connection. Each point goes to the server at once, and the track in the web app grows live.
- No connection. The device writes points to its memory, and the track in the web app breaks off at the last one delivered.
- The connection is back. The device sends what it stored, the points fall into the track at their own time, and the asset gets the “catching up” badge.
- The gap has filled in. The track is continuous, and the “Connectivity” panel marks this stretch as a history upload.
The “Connectivity” panel
The 📶 button in the header opens the devices’ connectivity bands for a day, a week or a month. Green: the device was online; light: there was no connection; orange: the device was uploading its stored history.

- Period: day, week, month
- A band per device: green online, light offline
- Legend
For the selected device there are details under the band: the share of time online, how many points arrived, how many times the connection dropped and the longest pause. This answers a question a track alone cannot settle: was the vehicle standing still, or was the connection lost. Details in Connectivity history.
WIM stations
The ⚖ button shows on the map the weigh-in-motion stations whose coordinates are known. The stations become visible once the map is zoomed in far enough, so as not to cover the whole country with icons. If the selected vehicle’s track is shown, its passages under the stations are marked on it: time and speed.

- Turn on the station layer
- Weigh-in-motion station
- Passage under a station: time and speed
This helps to answer a claim from a weighing station: you can see whether and when the vehicle passed under it. Details in WIM stations.
What else is on the map
- The account’s geofences are drawn as outlines with a caption; they are edited in the Geofences section.
- Buildings appear as a house icon; a click shows the name and address.
- The top right corner shows how many devices are online out of all of them.
In the apps
Web
Everything described above.
Windows
The same map with the device list, telemetry and history. The panels float and can be moved; the “Connectivity” panel remembers its place and size.
Android
The map, the device list, telemetry and track history; DVR video opens from the device card.
Telegram
The “Tracking” section with the map, the list and the selected device’s track; DVR video is turned on from the card.
If it did not work
- The device is not in the list. It was not added to the account or was added with a different number. Check the device number and the server port using How to connect a device.
- The device is online but not on the map. There is no satellite fix: the device is indoors or the antenna is covered. The system does not record such points, so that the track does not jump about.
- There is a gap in the track. Look at the “Connectivity” panel: a light stretch means there was no connection. If the device later uploads its history, the gap fills in by itself.
See also
Found a mistake, or didn’t find an answer? Write to us on Telegram or send us a request, and we will reply and fix the article.