

Axle load: the load on every axle in real time
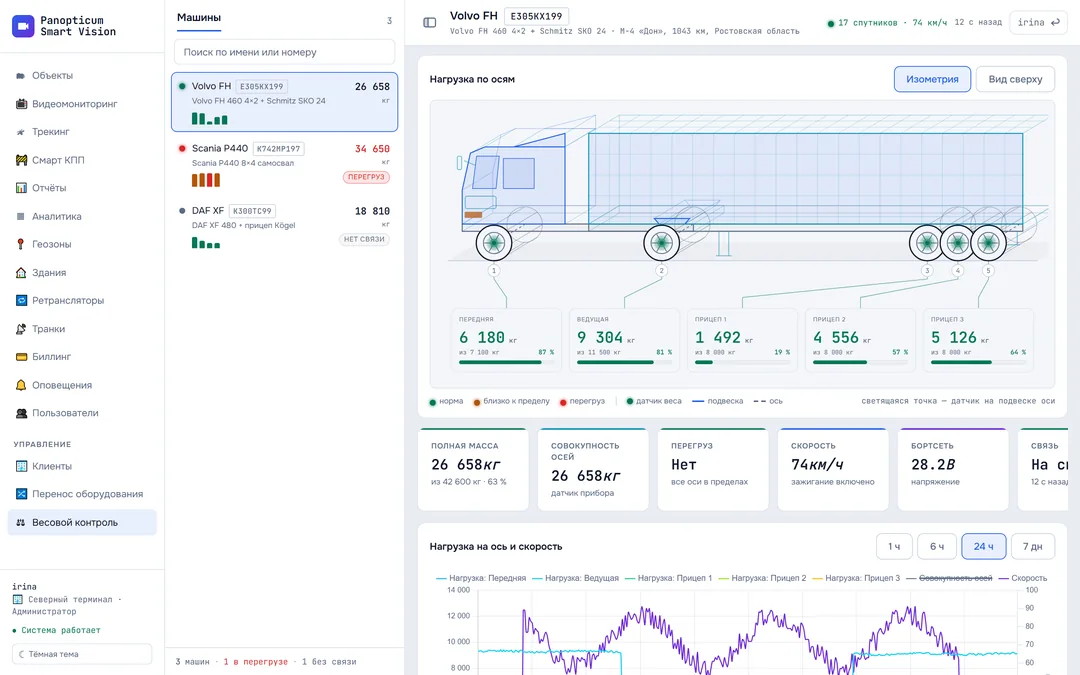
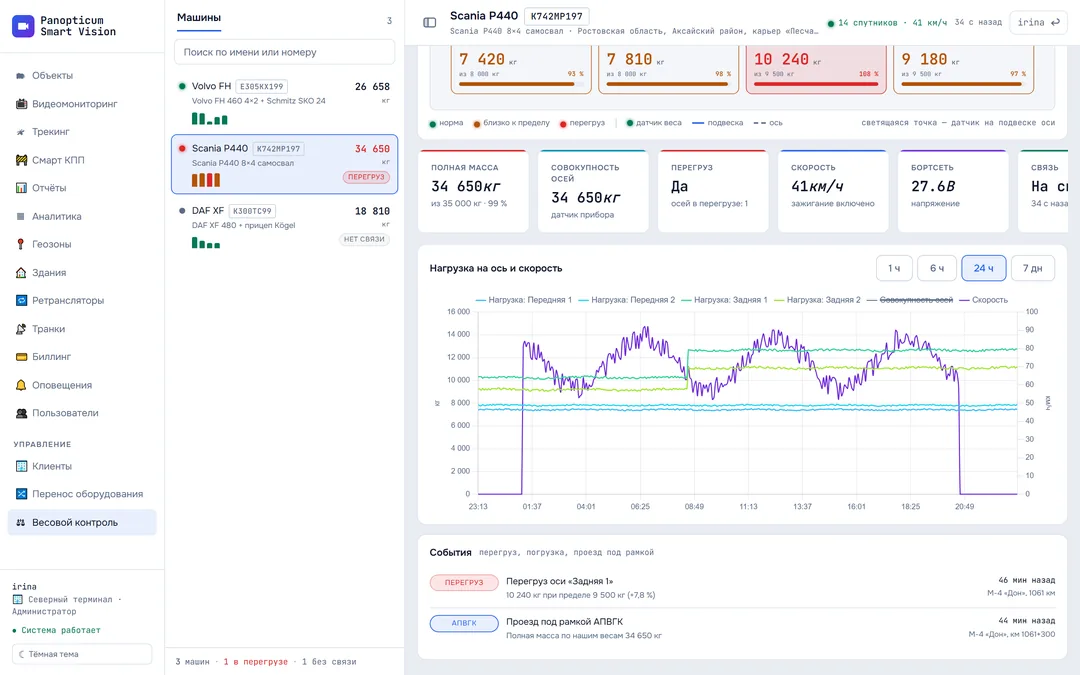
Load sensors on the suspension report the weight on each axle through the device on the vehicle. Panopticum shows the vehicle as a diagram, highlights an overloaded axle, draws a chart and logs loading, unloading and overloads.
This section’s interface is in Russian for now.
Features
Every axle separately
Front, drive and every trailer axle, each with its own limit.
Overload is visible at once
An axle over its limit turns red, and the event goes into the log.
Vehicle diagram
Isometric and top views: tractor unit, semi-trailer, trailer, tipper.
Load and speed on one chart
You can see where the vehicle was loaded and where it was unloaded.
Linked to WIM stations
The passage under a gantry and the weight from your sensors in the same minute.
The whole fleet in one list
How many vehicles are overloaded and which are out of contact.
The top view shows an imbalance
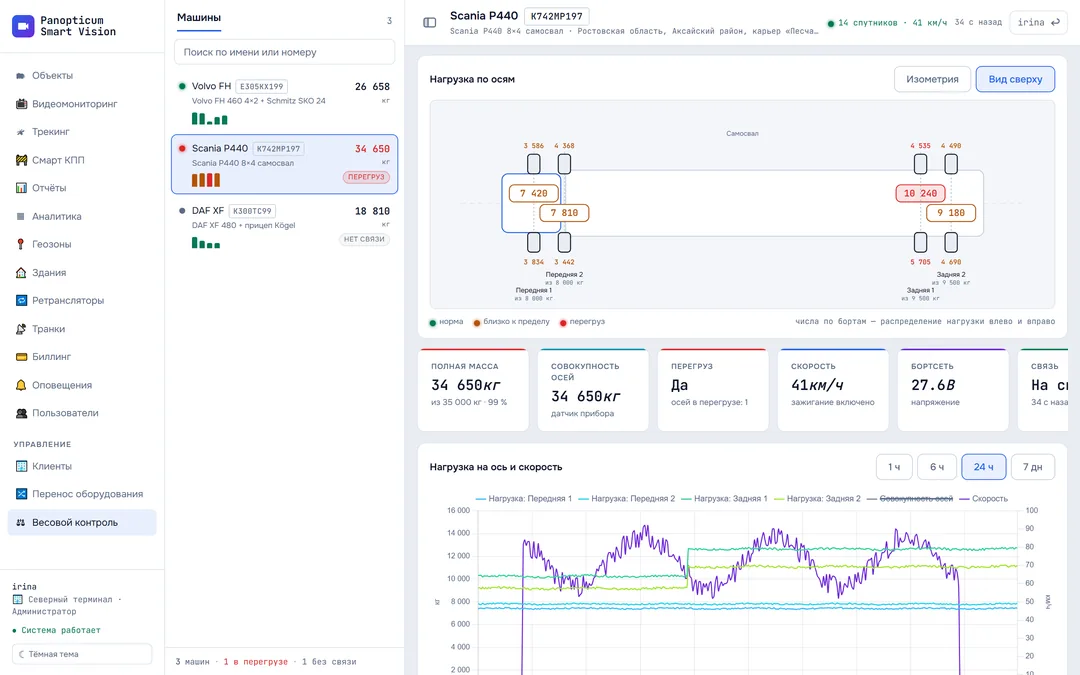
The top view splits the weight between the sides: you see not only an overloaded axle but also a load that has shifted to one side. Such an imbalance often explains a gantry’s claim.
Loading, unloading and passing a gantry
The load on each axle is shown together with speed: a step up while parked means loading, a step down means unloading. In the log, next to an overload, you see the passage under a WIM gantry with the gross weight from your own scales.
Gross weight and fleet totals
The vehicle’s gross weight and its limit, the combined axle load from the device sensor, on-board voltage and connectivity. At the bottom of the list, a total: how many vehicles are overloaded and how many are out of contact.
Specifications
| Vehicle layouts | rigid vehicle, tractor unit with semi-trailer, drawbar combination, tipper |
|---|---|
| Readings | load on each axle, combined axle load, overload, on-board voltage, ignition |
| Events | axle overload, loading, unloading, passing a WIM gantry, connection loss |
| Chart | axle load and speed over an hour, 6 hours, a day and a week |
Frequently asked questions
Which sensors are needed?
How do I set up axle load monitoring?
Will this help me dispute a fine from a gantry?
Which vehicles can be shown as a diagram?
Works together with
WIM station
Weigh-in-motion gantries on the map and a log of passages under them for disputing fines.
Learn moreTracking
GPS and GLONASS on the map. Carvis DVRs with up to 4 video channels, Navtelecom FLEX, Wialon IPS.
Learn moreReports
13 tables and 7 charts: trips, parking, engine hours, violations, geofences. CSV export and printing to PDF.
Learn moreWe will show it on your equipment
Tell us about your task, and we will show Panopticum on your cameras and vehicles
Or start on your own: after sign-up you get 14 days of the “Business” plan free, no card needed.
- We reply during working hours, fastest on Telegram
- We will help you connect cameras and devices remotely
- Only you and your staff see your data
Request sent
We will reply during working hours. If it is urgent, message us on Telegram.