

Reports: what the vehicle did over a day, a week, a month
13 tables and 7 charts from device data. Save templates, export CSV and print to PDF.
Features
Templates
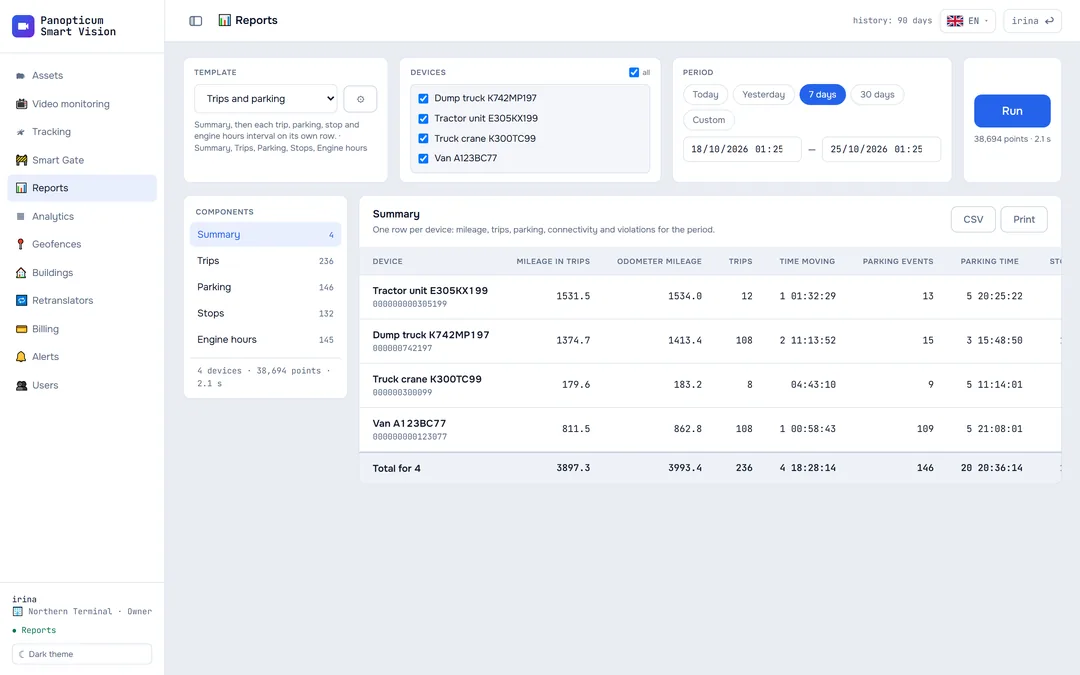
Speed threshold, minimum duration, totals, grouping by day.
Geofences and buildings instead of coordinates
The “Location” column shows the place name, not numbers.
CSV up to 50,000 rows
The trace is exported in full, not just what is on screen.
Print and PDF
The report prints from the browser and saves to PDF.
Honest gaps
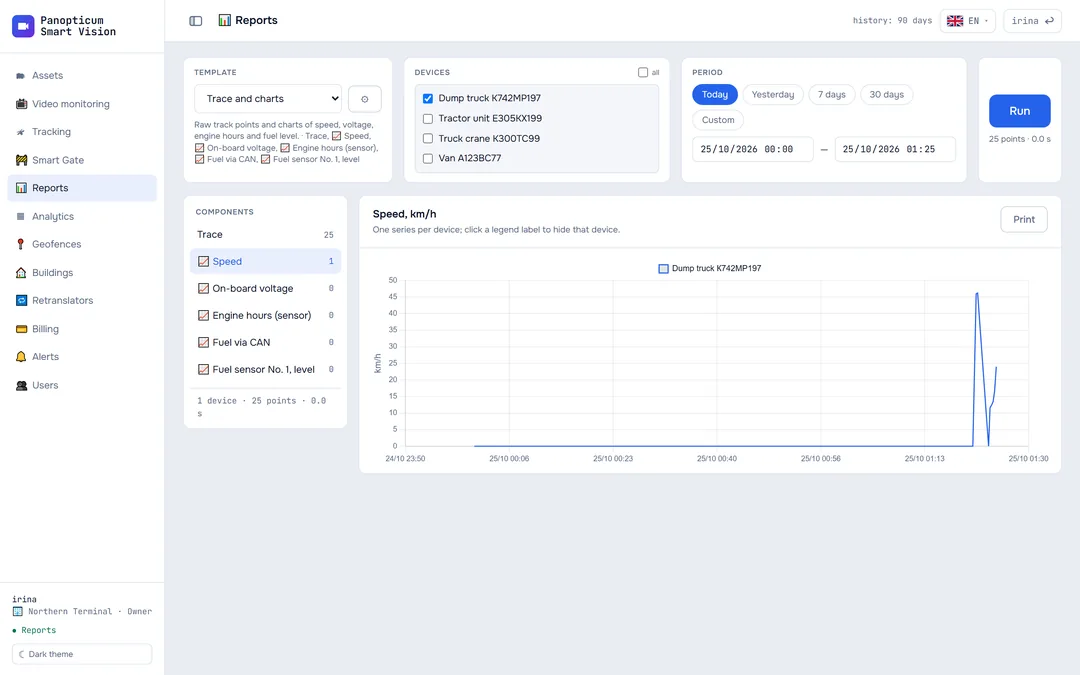
A connection loss shows as a gap in the chart, not as a straight line across the whole night.
Geofence filter
Trips started inside a zone or outside all zones.
13 tables and 7 charts
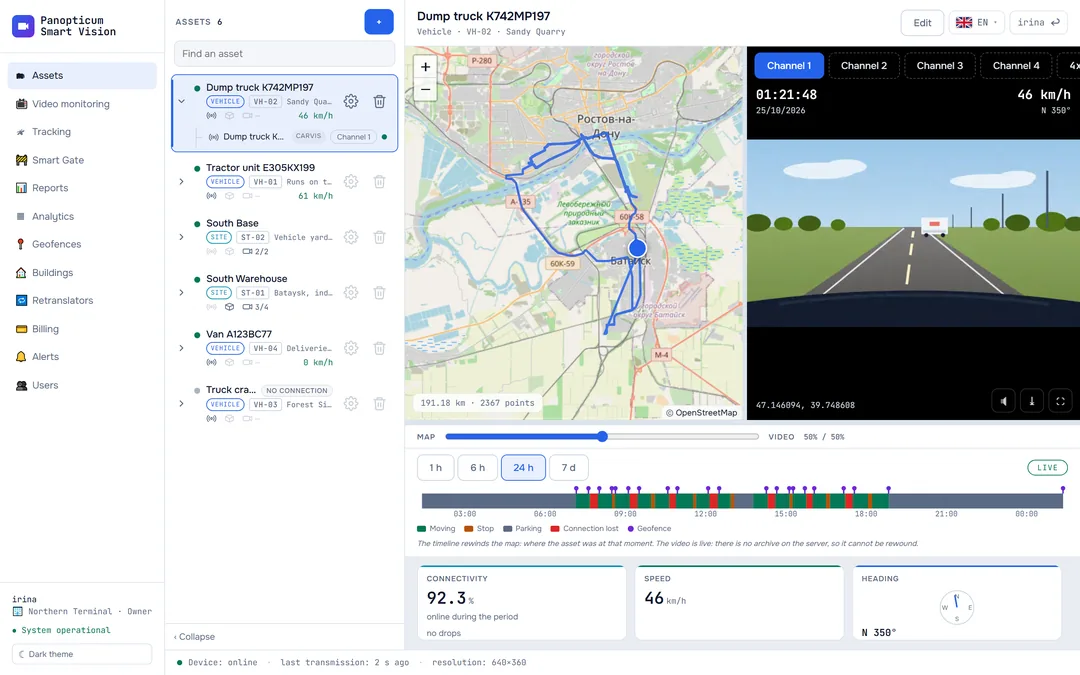
Trips, stops and parking are calculated by the same rules as the timeline in “Assets”: the report and the screen never disagree.
Movement
- Summary
- Trips
- Parking
- Stops
- Engine hours
- Trace
Violations
- Speeding
- Violations
Geofences
- Geofences
- Trips between geofences
- Missed geofences
Connectivity
- Connection losses
- Latest data
Charts
Sensor charts
Speed, altitude, satellites, on-board voltage, engine hours from the sensor, fuel via CAN and the fuel level sensor. One series per device, in the theme colours.
Frequently asked questions
How long is the history kept?
Can I export a report?
Works together with
Tracking
GPS and GLONASS on the map. Carvis DVRs with up to 4 video channels, Navtelecom FLEX, Wialon IPS.
Learn moreGeofences
Polygon, corridor or circle. Entry, exit, speed, long stay and absence.
Learn moreSLA analytics
Availability of each camera as a percentage: which ones went down, when and for how long.
Learn moreWe will show it on your equipment
Tell us about your task, and we will show Panopticum on your cameras and vehicles
Or start on your own: after sign-up you get 14 days of the “Business” plan free, no card needed.
- We reply during working hours, fastest on Telegram
- We will help you connect cameras and devices remotely
- Only you and your staff see your data
Request sent
We will reply during working hours. If it is urgent, message us on Telegram.