

The Reports section answers with tables and charts the question ‘what was the vehicle doing over the period’: how far it drove, where and how long it stood, when it was speeding, which geofences it entered, when the connection was lost. A report is built from the track history, and that is kept for 90 days.
How to build a report
A report is put together in three steps: template, devices, period. Then the “Run” button.

- Report template
- Devices
- Period
- Build the report
- The template sets which tables and charts the report consists of. Six templates are there from the start: “Summary for the period”, “Trips and parking”, “Geofences”, “Connectivity”, “Violations” and “Trace and charts”. Under the list it says what the selected one includes.
- Devices: tick the vehicles you need, or all of them at once with the “all” box.
- Period: “Today”, “Yesterday”, “7 days”, “30 days” or “Custom” with the date and time of the start and end. The top right corner says how many days back the history is kept.
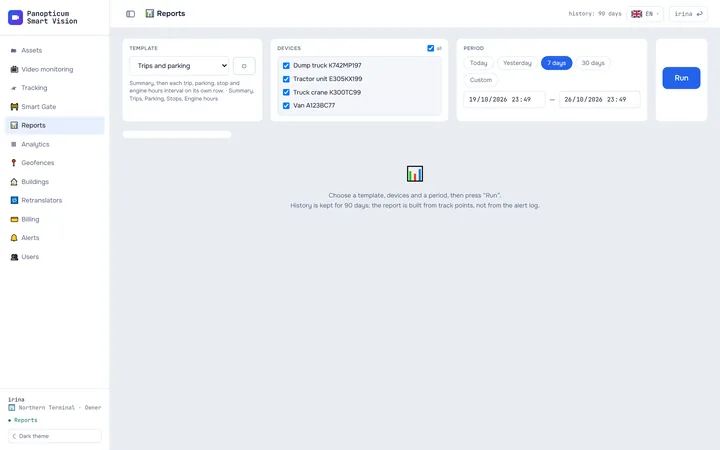
1Choose a template, for example “Trips and parking”.
2Tick the devices.
3Choose the period.
4Press “Run”.
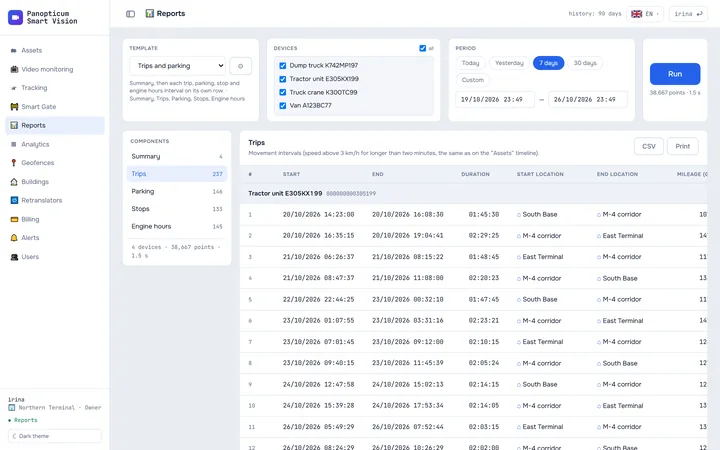
5The report’s components are on the left: a click opens a table or a chart.
6“CSV” exports the table as it appears on screen; “Print” saves a PDF.
How to read the result
On the left there is the list of the report’s components with the number of rows, on the right the selected component. A table is grouped by device, a group has a “Total” row, and with several devices there is also “Total for all”. Clicking a column header sorts the table.

- Report components
- Table: a row per trip, a total per vehicle
- CSV and printing
Trips, stops and parking are counted by the same rules as the timeline in Assets, so the numbers in a report and on the timeline agree:
| State | Rule |
|---|---|
| Trip | Speed above 3 km/h |
| Stop | The vehicle stands, the ignition is on |
| Parking | The vehicle stands, the ignition is off |
A stretch shorter than two minutes does not count as a state: a minute at traffic lights stays part of the trip. If the device does not report the ignition, all its stops go into “Parking”.
0 km/h · ignition off → parking
- Faster than 3 km/h: a trip.
- Standing, ignition on: a stop, for example loading or a traffic jam.
- Standing, ignition off: parking. Coordinate jitter while parked (1 or 2 km/h) does not count as a trip.
- A stretch shorter than 2 minutes does not count as a state: a minute at traffic lights stays part of the trip.
The “Location” column
If a point lies inside a geofence, the column shows its name; if a building from the Buildings section stands nearby, closer than 150 metres, the building’s name. Otherwise there are coordinates, and the address is filled in as you scroll the table. Captions by geofences and buildings can be turned off in the template parameters.
Export and printing
- CSV on each table exports it just as it is on the screen: in your time zone, with the same sorting and with the addresses already found. The file opens in Excel.
- Print sends the whole report to print: all the tables and charts in a row, with a header (template, devices, period). In the print window choose Save as PDF to get a file.
- Trace shows no more than 5,000 points on the screen, while its CSV exports the full series, up to 50,000 rows.
Your own template
The cog button next to the template opens its settings. A built-in template does not change: the changes are saved into a new template, its copy. In the settings:

- which tables the report includes and which columns they have;
- parameters: the speed limit (90 km/h by default), the minimum speeding duration (10 seconds), whether to label the “Location” column with geofences and buildings;
- for tables with intervals: the minimum duration of a row (60 seconds by default), the “Total” row, numbering, grouping by day and filtering by geofences (“starting in a geofence” or “starting outside geofences”);
- charts: speed, altitude, satellites, voltage, engine hours, fuel.
A template can be downloaded as a file and loaded from a file: this is how it is shared with colleagues from another account. What each table and each chart shows is covered in detail in Report tables and charts.
Limits
- A report is built straight away while you wait. If the period has too many points, the report will ask you to narrow the period or choose fewer devices.
- There is no fuel in litres in the reports: the devices send a level without calibration. There are charts of the fuel level from CAN and from the sensor in percent.
- History older than 90 days is not kept.
In the apps
Web
Everything described above.
Windows
The Reports section with the same templates, tables, charts and CSV export; the button that runs a report has its own caption there. Your own templates are not edited here: they are set up in the web app, and the app picks them up with its refresh button. There is no printing; for Excel there is CSV. More in The Windows app.
Android
The same templates and tables. The first column of a table is pinned, the others scroll sideways; tapping a row opens it in full with a button that shows the point on the map. Printing and PDF go through the phone’s system printing.
Telegram
In the Telegram panel, Reports open from the More menu: template, devices, period and the result by component.
If it did not work
- The table is empty. The device has no points for the period: check the period and the device’s connectivity history (Connectivity history).
- There are no “Stops”. The device does not report the ignition; all its stops are in “Parking”.
- There are no engine hours from the sensor. Not every device sends an engine hours sensor; the “Engine hours” column based on the ignition is there anyway.
- The report asks you to narrow the period. Choose a shorter period or fewer devices.
See also
Found a mistake, or didn’t find an answer? Write to us on Telegram or send us a request, and we will reply and fix the article.