

Reports: 13 tables and 7 charts
Trips, parking, engine hours, violations and geofences for any period. Templates, CSV and printing to PDF.
The dashboard has a new “Reports” section. Choose a template, devices and a period, and the report is built as tables and charts.
- Summary, trips, parking, stops, engine hours and trace
- Speeding and violations
- Geofence visits, trips between geofences and missed geofences
- Connection losses and latest data
- Charts of speed, altitude, satellites, voltage, engine hours and fuel
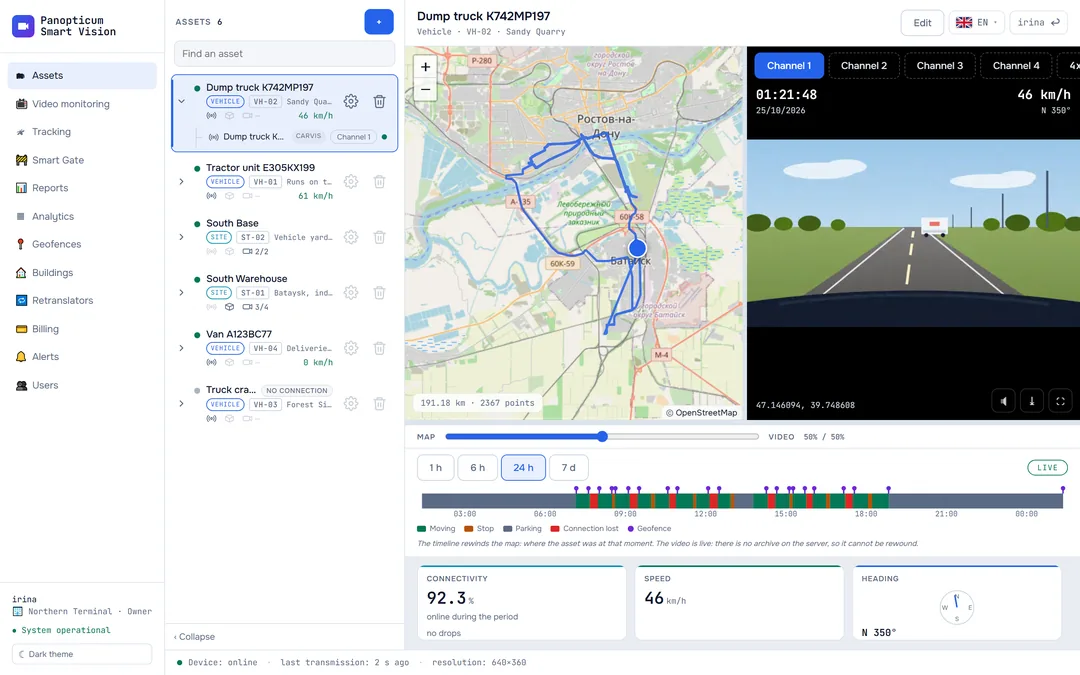
Trips and parking are calculated by the same rules as the timeline in “Assets”, so the report and the screen never disagree. The “Location” column shows the name of a geofence or building instead of coordinates. The trace can be exported to CSV in full, up to 50,000 rows.
We will show it on your equipment
Tell us about your task, and we will show Panopticum on your cameras and vehicles
Or start on your own: after sign-up you get 14 days of the “Business” plan free, no card needed.
- We reply during working hours, fastest on Telegram
- We will help you connect cameras and devices remotely
- Only you and your staff see your data
Request sent
We will reply during working hours. If it is urgent, message us on Telegram.